Glioma
Rmarkdown source codes for generating this site can be found: https://github.com/uni-hd/Irene/blob/master/index.Rmd
PC
PC composition
df=data.frame(melt(prcomp(dat$Dobs)$rotation),rep(levels(as.factor(conf$factor)),ncol(dat$Dobs)))
colnames(df)=c("id","PC","Loadings","Mark")
ggplot(df,aes(x=Mark,y=Loadings,fill=Mark))+geom_bar(stat='identity')+facet_grid(PC~.)+coord_flip()+theme(legend.position="none",axis.text.x=element_text(angle=90,vjust=0.5))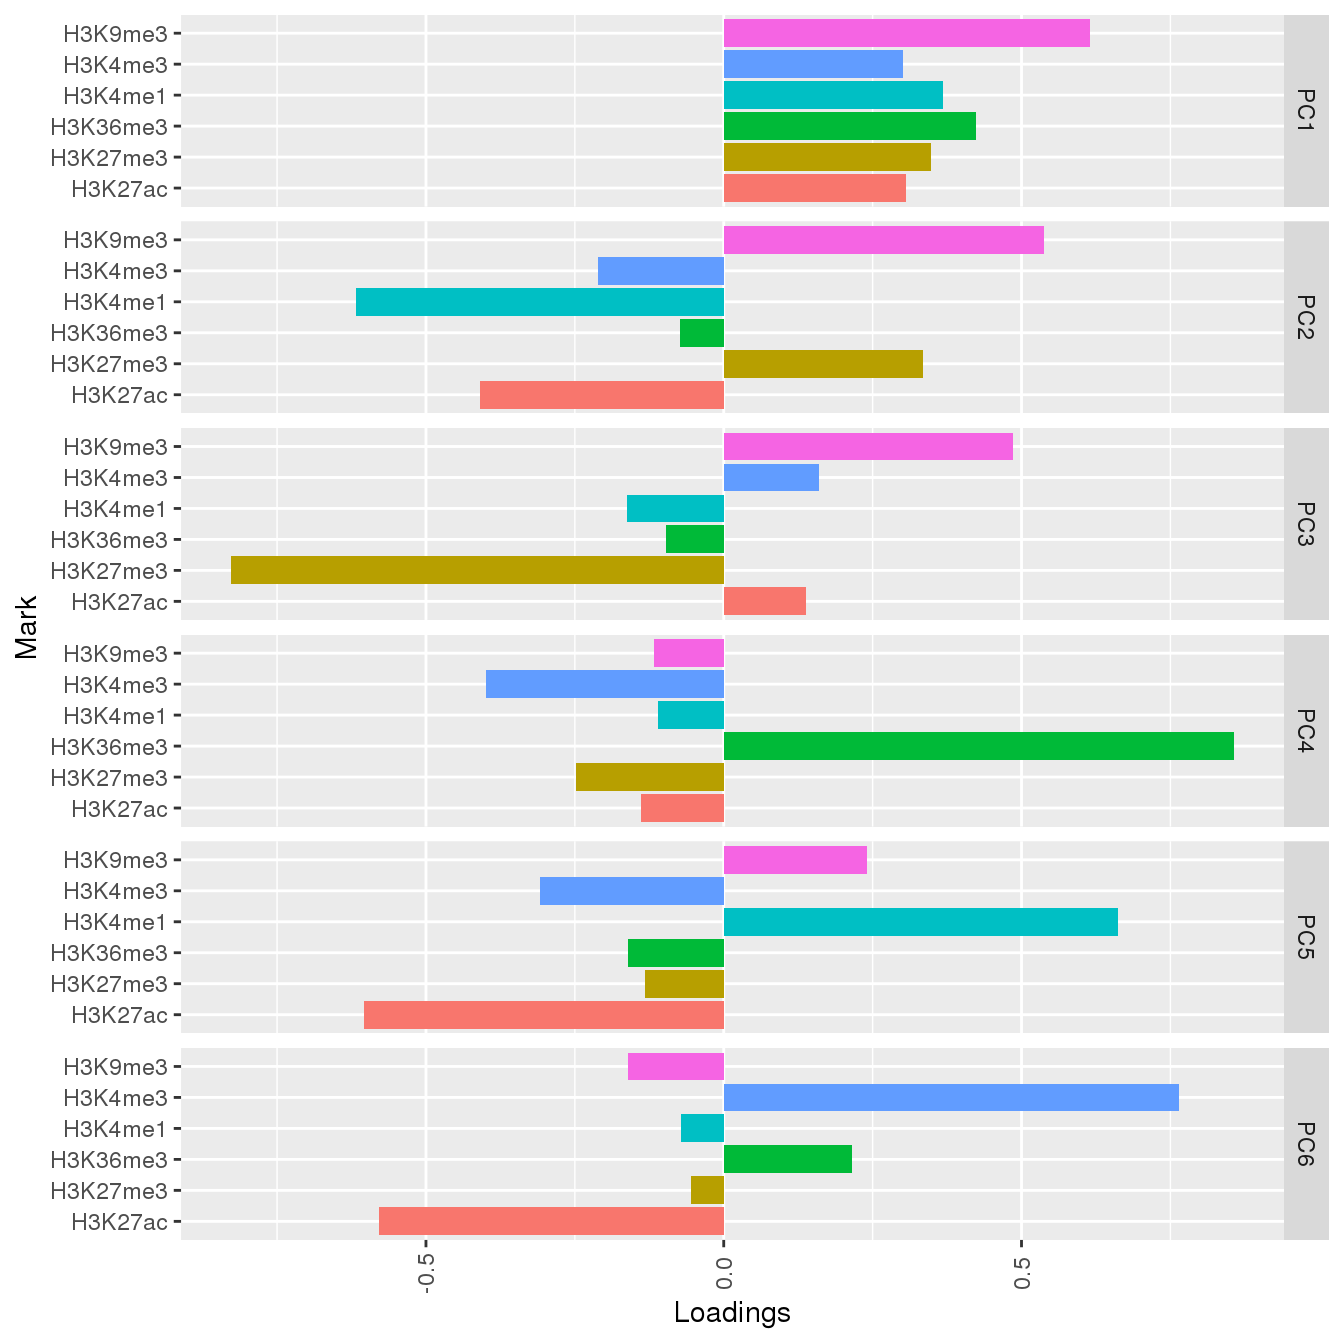
PC variance
ggplot(vec2df(summary(prcomp(dat$Dobs))$importance[2,]),aes(name, value, fill=name))+geom_bar(stat="identity",position="stack")+labs(x='', y="Variance")+scale_y_continuous(labels = scales::percent) 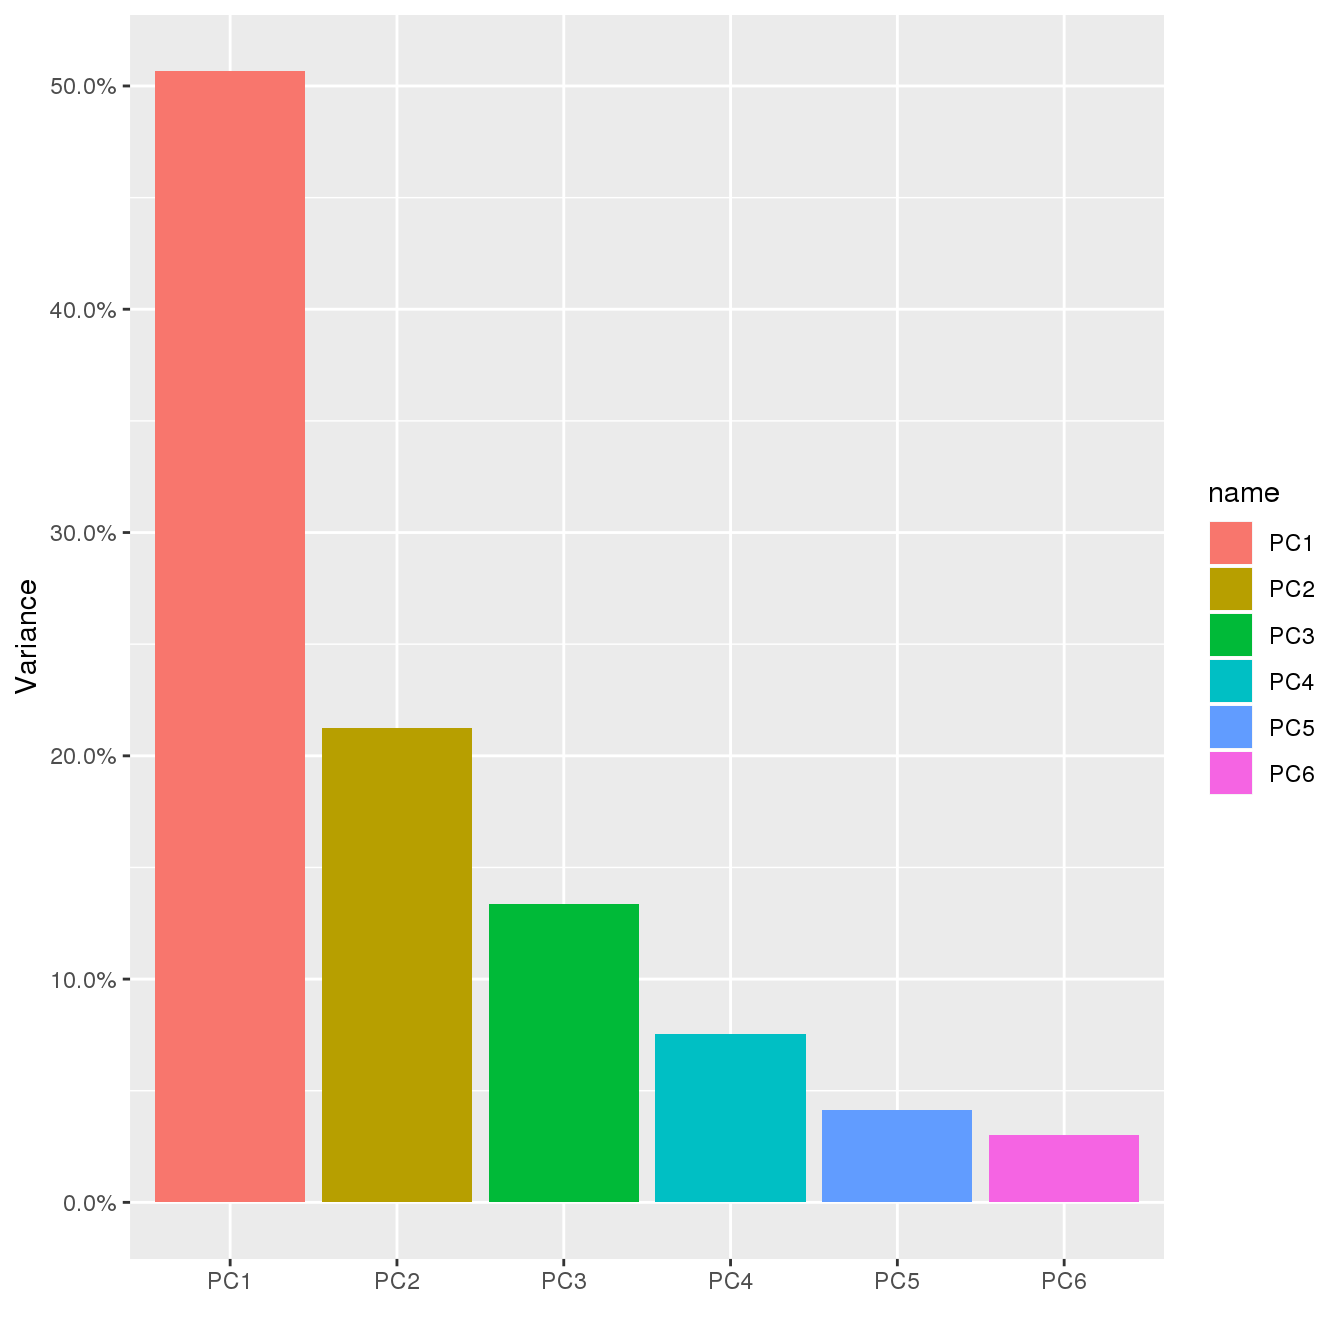
ECDF
The cancer marker gene ranks with respect to their positions in the Irene and promoter rank lists.
df=rbind(data.frame(get.rankid(marker, enh[[i]]),list='Irene'), data.frame(get.rankid(marker, prom[[i]]),list='Promoter'))
ggplot(df,aes(rank,colour=list))+stat_ecdf(pad=TRUE)+labs(x="Rank",y="ECDF")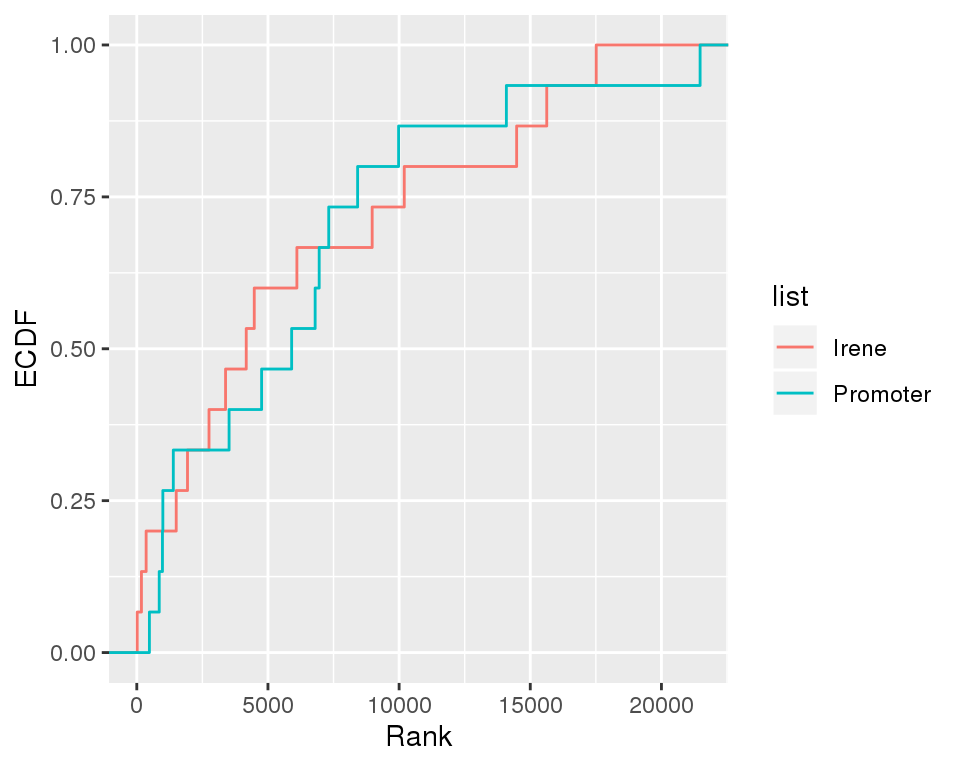
datatable(df[order(df$rank),],rownames=FALSE,filter="top",options=list(pageLength=5,scrollX=TRUE,autoWidth=TRUE))Rank
The complete rank list by incoporating enhancers into the Page rank (PR) scores.
pr <- get.generankscore(rank[[i]]) * 1e5
datatable(data.frame(names(pr), as.numeric(sprintf("%.2f", pr))),rownames=F,colnames=c('Gene name','PR score (x 1e-5)'),filter="top",options=opt)
Data validity
Distribution densities
matdensity <- function(object, groupFactor, type = "l",
                       lty = 1, brewer.n = 8, brewer.name = "Dark2", ...){

    getdensity  <- function(object){
        min.object <- min(object[is.finite(object)], na.rm = TRUE)
        max.object <- max(object[is.finite(object)], na.rm = TRUE)
        densityMat <- apply(object, 2, function(z){
            stats::density(z, from = min(z[!is.na(z) & z>min.object]), to = max.object, na.rm = TRUE)$y
        })
        x = seq(from=min.object, to=max.object, length.out = nrow(densityMat))
        list(densityMat = densityMat, x = x)
    }
    output <- getdensity(object)

    grDevices::palette(brewer.pal(brewer.n, brewer.name))
    col = brewer.pal(brewer.n, brewer.name)
    groupFactor <- as.factor(groupFactor)
    graphics::matplot(x = output$x, output$densityMat, col = col[as.integer(groupFactor)], type = type,
            lty = lty, xlab = 'Intensity', ylab = 'Density')
    legend('topright',levels(groupFactor),col=col,lty=1,lwd=3)
}
matdensity(ndata[[i]]$data, confs[[i]]$factor)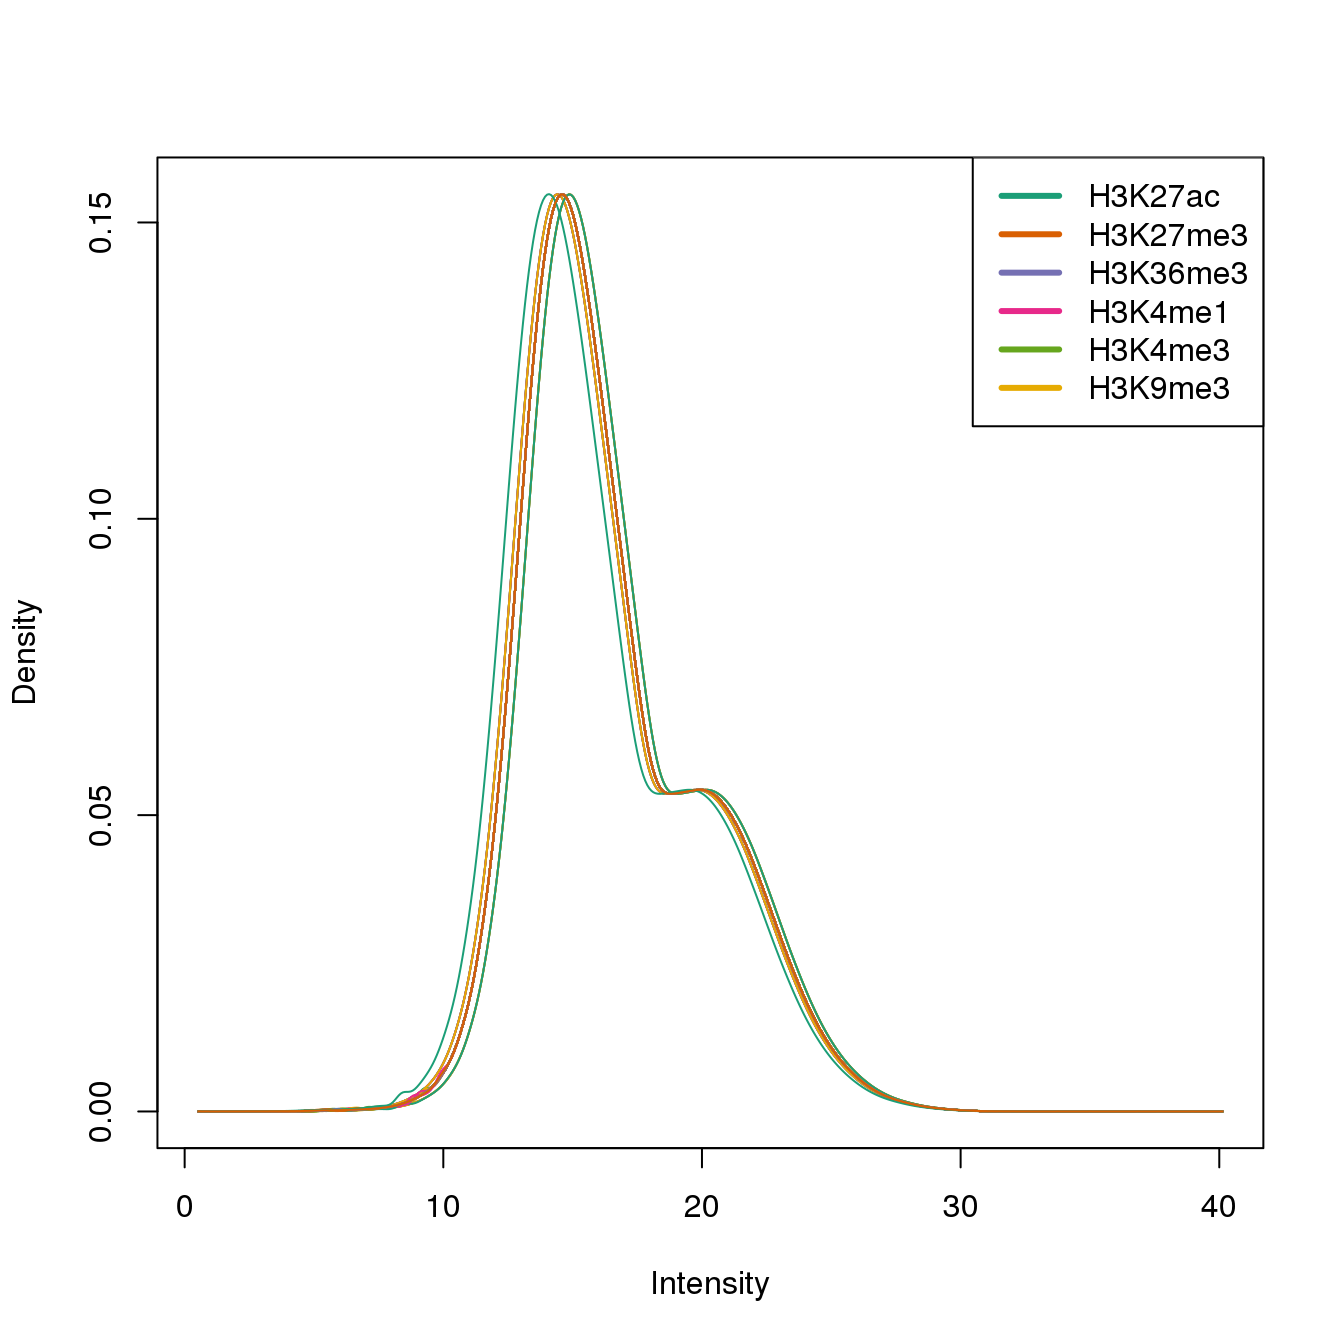
Genes of interests
The dPC1 values of the enhancers which interact with the promoters of cancer marker genes. Multiple promoters (if present) are indicated with _1, _2, …
hi=data.frame(hi,dat$bed[match(hi$prom,dat$bed[,4]),],dPC1=dat$PC[match(hi$enh,dat$bed[,4]),1])
hi=hi[hi$seqnames==hi$V1,]
hi=data.frame(hi[,c('prom','enh','dPC1')],gene=gsub('_\\d+','',hi$prom),d=rowMeans(hi[,c('start','end')])-rowMeans(hi[,c('V2','V3')]))
df=hi[hi$gene %in% marker,]
df=df[!is.na(df$dPC1),]
ff=paste0('plots/',i)
dir.create(ff, showWarnings=F, recursive=T)
gn=unique(df$gene)
fn=unlist(lapply(gn,function(gene){
p=ggplot(df[df$gene==gene,], aes(d,0))+ geom_point(aes(col=dPC1),size=1,position=position_jitter())+ facet_grid(prom~.)+ xlim(c(-1e6,1e6))+ xlab('Distance to TSS (bp)')+ theme(panel.background=element_blank(), axis.title.y=element_blank(), axis.text.y=element_blank(), axis.ticks.y=element_blank(), axis.text.x = element_text(angle=30, vjust=.5))+ scale_color_gradient2(midpoint=0, low="blue", mid="white", high="red", space="Lab")
fnm=paste0(ff,'/',gene,".png")
ggsave(fnm,width=6,height=3,units="in")
fnm
}))
names(fn)=gn
bsselect(fn, type = "img", selected = gn[1], live_search = TRUE, show_tick = TRUE)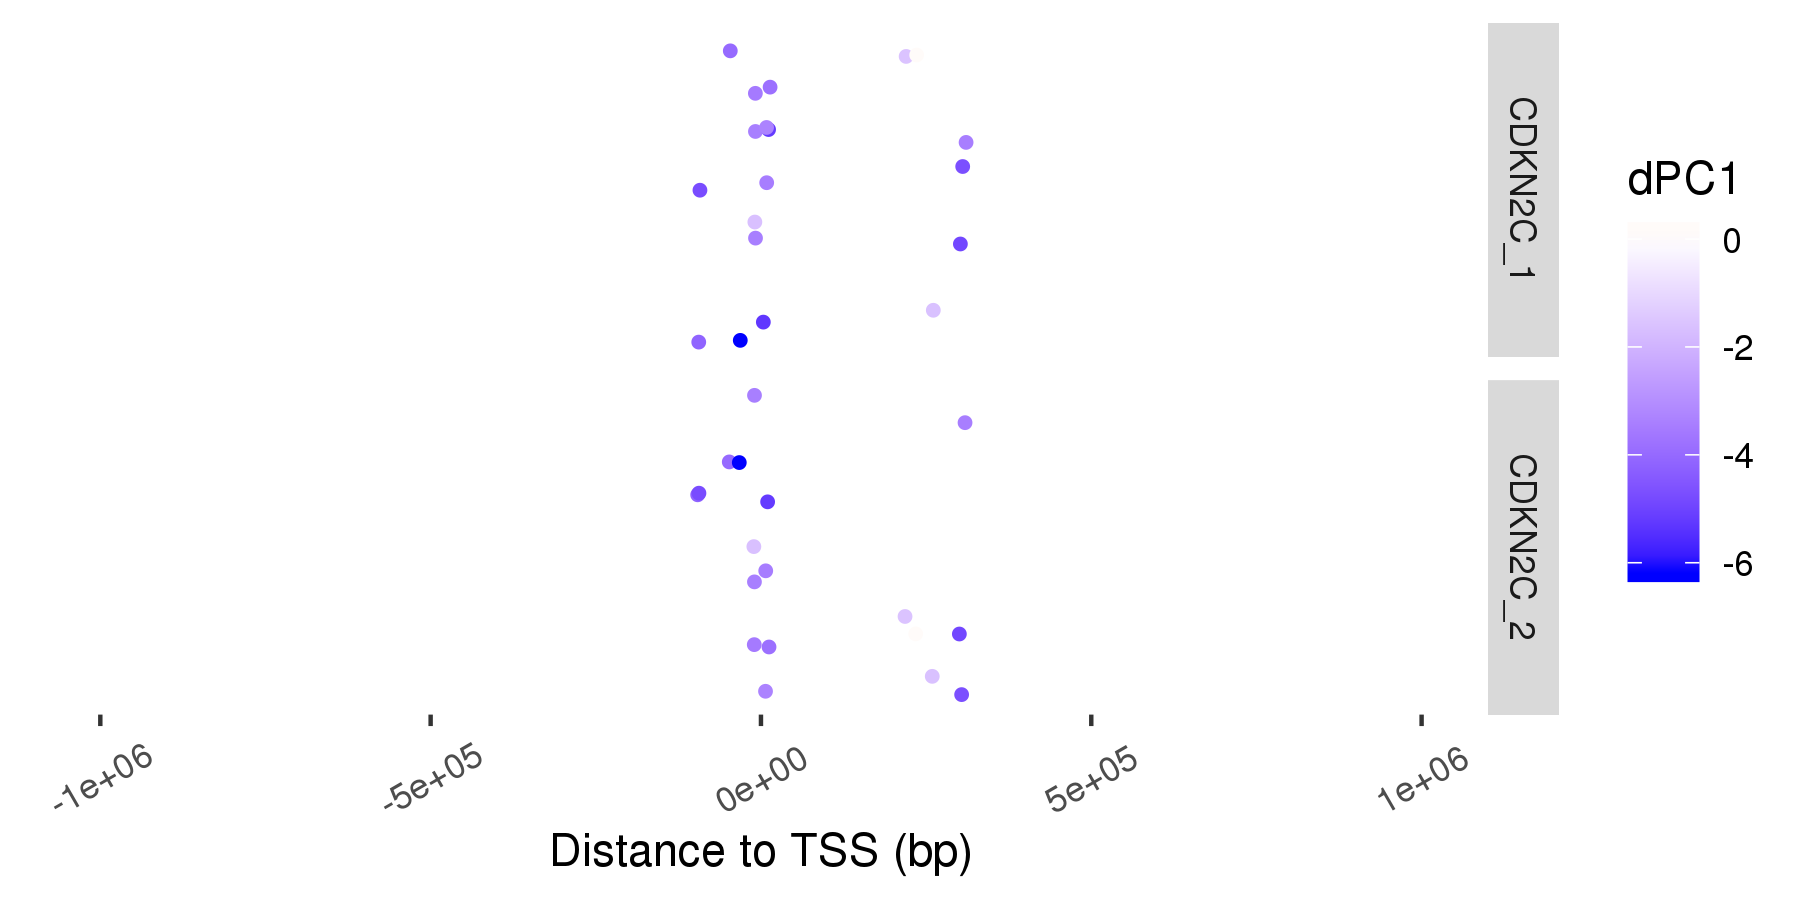
Pathways of interests
Here the top 4,000 genes mapped to KEGG pathways from each rank list are highlighted with the corresponding colors: Promoter Irene Both
th=1:4000
fn=read.table('res/keggpath.txt')
gn=apply(fn,1,function(x){
genes=getKEGGnodeNames(paste0('res/kegg/',x[2],'.xml'))
enh1=lapply(rank,function(d)names(get.generankscore(d))[th])
prom1=lapply(promrank,function(d)names(get.generankscore(d))[th])
getKEGGlink(x[2],getKEGGnodeId(prom1[[i]],genes),getKEGGnodeId(enh1[[i]],genes))
})
names(gn)=substr(fn[,1],6,nchar(fn[,1]))
bsselect(gn, type = "iframe", selected = 'PATHWAYS_IN_CANCER', live_search = TRUE, show_tick = TRUE)
fn=read.table('res/keggpath.txt')
# preload xml as genes
# genes=apply(fn,1,function(x) getKEGGnodeNames(paste0('res/kegg/',x[2],'.xml')))
# names(genes)=fn[,2]
# if everything has been preloaded
gn=lapply(names(genes),function(d) getKEGGlink(d,getKEGGnodeId(prom1[[i]],genes[[d]]),getKEGGnodeId(enh1[[i]],genes[[d]])))
names(gn)=substr(fn[,1],6,nchar(fn[,1]))
bsselect(gn, type = "iframe", selected = 'PATHWAYS_IN_CANCER', live_search = TRUE, show_tick = TRUE)g=igraph.from.graphNEL(parseKGML2Graph('~/tmp/kegg/hsa05200.xml'))
nodes=getKEGGnodeNames('res/kegg/hsa05200.xml')
nodes$V1=paste0('hsa:',nodes$V1)
median(degree(g,mode='out')[getKEGGnodeId(prom1[[i]],nodes)])
median(degree(g,mode='out')[getKEGGnodeId(enh1[[i]],nodes)])
write.table(enh1[[i]],file=paste0('~/tmp/i/',i,'.rnk'),quote=F,sep="\t",col.names=F)Qi Wang, Yonghe Wu, Tim Vorberg, Roland Eils and Carl Herrmann. Integrative ranking of an epigenetic network of enhancers facilitates the discovery of novel cancer marker genes. 2019